viernes, 23 de septiembre de 2016


FROM HIPPARCHUS TO HIPPARCOS: A SONIFICATION OF STELLAR CATALOGUES

22 September 2016
ESA's Gaia mission recently released its first batch of data, based on observations obtained with the satellite during its first 14 months of science operations. This ambitious mission is the culmination of over two thousand years of astrometry – the science of charting the sky. 

A new sonification demonstrates in a novel way the remarkable progress that has been made in the lead up to the first data release from Gaia.
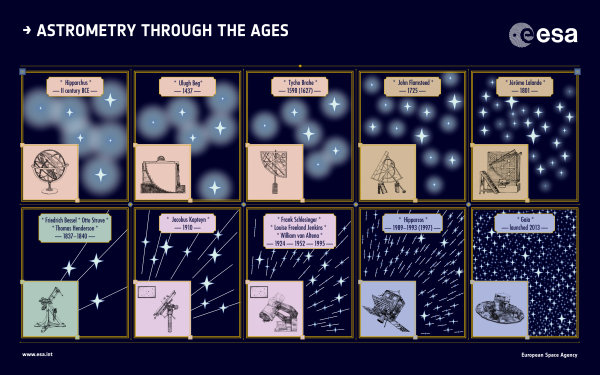
Astrometry through the ages. Credit: ESA
Astronomy is one of the first natural sciences developed by early civilisations across the globe, and astrometry is one of the oldest branches of astronomy. Over the centuries, as technical advances were made and new instruments became available, the history of mapping the heavens gradually unfolded. Astronomers could see fainter and more distant celestial objects, measuring the position, brightness and colour of each star ever more accurately to determine their distance, their velocity through the Galaxy and their physical composition.
To convey the progress made in the field of astrometry, a new representation has been created using sonification – the practice of turning data into sound – by Jamie Ferguson in collaboration with ESA. 
Jamie first became interested in sonification during his Masters Degree studies in computer science, and he has recently applied this technique to the challenge of communicating astronomy to visually impaired students. He is soon to begin his PhD studies on using sonification in the context of astronomy research, education and outreach.
"The human ear is incredibly efficient at recognising patterns in sounds, making sonification an ideal tool for locating patterns and anomalies in extensive datasets that are common in astronomy – such as the enormous quantity of data contained in stellar catalogues," said Jamie.
"Sonification is not only an incredibly useful research tool in astronomy, but it is beginning to allow the field to be more open and engaging to people who are visually impaired and cannot interact with the common visual supports that accompany astronomy in the media."
After analysing a number of ancient and modern catalogues of stars, Jamie created a software to map the various astronomical parameters provided in each catalogue into different dimensions in a soundscape. The result is a short audio clip, From Hipparchus to Hipparcos: A sonification of stellar catalogues, which can be listened to and downloaded from ESA's SoundCloud channel.
This project was developed in the weeks leading to the first Gaia data release, so it portrays the status of astrometric catalogues prior to the advent of Gaia. An extension of the sonification, including data from the first Gaia release, will follow.
 

From Hipparchus to Hipparcos starts with a sonification of the ancient star catalogue compiled by Greek astronomer Hipparchus of Nicaea in the second century BCE and proceeds through several other historical catalogues, before ending with the Hipparcos Catalogue, published in 1997 and based on data from ESA's Hipparcos satellite, Gaia's predecessor and the first space mission dedicated to astrometry.
The improvement in the quantity and precision of data, as well as the increased information content and dimensions contained in each catalogue, are palpable as the sound clip evolves from the ancient Hipparchus to the modern Hipparcos.
For the most ancient five catalogues (see list below), which only list stellar positions and brightnesses, Jamie mapped each star in a virtual sound space based on its 2D position on the sky, and used the brightness of each star to modulate the pitch of each sound. He also added a background of white noise to convey the accuracy of the measurements – this becomes less audible for the more modern and accurate catalogues.
In the case of the first three catalogues (Hipparchus, Ulugh Beg and Tycho Brahe), the sound corresponding to each star is played individually; for the later, larger catalogues (Flamsteed, Lalande, the Yale Trigonometric Parallax Catalogue and the Hipparcos Catalogue), the sounds corresponding to more than one star are played simultaneously to compress the great number of stars contained in these catalogues in the same time length.
Since the distances to the stars were not known until the nineteenth century, the sounds all have the same volume in the first five catalogues. Volume is then used as an additional parameter in the final two catalogues (the Yale Trigonometric Parallax Catalogue and the Hipparcos Catalogue) to convey the stellar distances measured via parallax – the annual shift of a star's position in the sky, caused by Earth's motion around the Sun and inversely proportional to the star's distance.
The modern catalogues contain a wealth of information beyond stellar positions and distances, so Jamie had to create additional sounds to convey the extra dimensions probed by these catalogues. He added a 'hiss' sound, which is played once for every 5 iterations of the main sound, to represent the stellar colours (which are, in turn, indicative of stellar temperatures). The frequency of the hiss is lower for bluer/hotter stars and higher for redder/cooler ones.
For the Hipparcos Catalogue, at the end of the clip, Jamie encoded information about the proper motion of the stars – the projection on the sky of the star's true motion through space – in the duration of the hiss, which is short for fast-moving stars and longer for slower-moving stars.
More information about the sampled catalogues can be found below.
 

FROM HIPPARCHUS TO HIPPARCOS: A SONIFICATION OF STELLAR CATALOGUES - DETAILS OF THE AUDIO FILE

The sonification of each catalogue lasts about 15 seconds in the sound clip.
Instruments: Naked eye observations, astrolabes, sextants and quadrants
1) Hipparchus of Nicaea compiled the oldest known comprehensive catalogue of stellar positions in the second century BCE. His work, based on even more ancient observations from Assyro-Babylonian astronomers, was handed down three hundred years later by Ptolemy, in his second-century treatise known as the Almagest, 'The Greatest'.
Hipparchus's catalogue was compiled with naked-eye observations and the few instruments available at the time (gnomons, astrolabes, and armillary spheres). It lists the positions of 850 stars with a precision of less than one degree [1].
 

Parameters used to create the sound: Pitch (star brightness) and location in the sound space (star position: right ascension and declination); background noise to convey accuracy of measurements. Each star is played individually.
2) In the fifteenth century, Ulugh Beg of the Timurid dynasty created a catalogue of 994 stars. Ruling over Central Asia, he was also an astronomer and mathematician, and constructed an enormous sextant with a radius of 36 metres in Samarkand, located in present-day Uzbekistan. Ulugh Beg's catalogue has a precision slightly better than that of Hipparchus.
 

Parameters used to create the sound: Pitch (star brightness) and location in the sound space (star position: right ascension and declination); background noise to convey accuracy of measurements. Each star is played individually.
3) In the late sixteenth century, Danish astronomer Tycho Brahe measured the positions of about 1000 stars with a precision of about one arcminute [2], using large quadrants and sextants at the Uraniborg observatory on the island of Hven (in present-day Sweden). His catalogue was completed in 1598 and published in 1627.
 

Parameters used to create the sound: Pitch (star brightness) and location in the sound space (2D position: right ascension and declination); background noise to convey accuracy of measurements. Each star is played individually.
Instruments: Telescope, quadrants, sextants
4) In 1725, English astronomer John Flamsteed published the first stellar catalogue compiled with the aid of a telescope, listing the positions of almost 3000 stars with a precision of 10-20 arcseconds.
 

Parameters used to create the sound: Pitch (star brightness) and location in the sound space (2D position: right ascension and declination); background noise to convey accuracy of measurements. Groups of two stars are played simultaneously.
5) In 1801, French astronomer Jérôme Lalande published an even greater catalogue with the position of 50 000 stars and a precision of around three arcseconds.
 

Parameters used to create the sound: Pitch (star brightness) and location in the sound space (2D position: right ascension and declination); background noise to convey accuracy of measurements. Groups of three stars are played simultaneously.
Instruments: Telescope, photography
6) The Yale Trigonometric Parallax Catalogue was published in 1995 by American astronomer William van Altena, who completed the work started by Frank Schlesinger in 1924 (who had made a huge step forward in the field thanks to progresses in the use of photographic plates) and continued by Louise Freeland Jenkins in 1952. It is the largest catalogue of stellar parallaxes compiled with ground-based telescopes, listing positions and parallaxes for over 8000 stars, with a precision of about 0.01 arcseconds.
 

Parameters used to create the sound: Pitch (star brightness) and location in the sound space (2D position: right ascension and declination); volume (distance); hiss (colour); background noise to convey accuracy of measurements. Groups of five stars are played simultaneously.
Instrument: Space telescope
7) ESA's Hipparcos mission, operating from 1989 to 1993, was the first space telescope devoted to measuring stellar positions. The Hipparcos catalogue, released in 1997, contains the position, parallax and proper motion of 117 955 stars with a precision of 0.001 arcseconds, allowing astronomers to probe stellar distances out to over 300 light-years.
 

Parameters used to create the sound: Pitch (star brightness) and location in the sound space (2D position: right ascension and declination); volume (distance); hiss (colour); length of hiss (proper motion). The very high accuracy of this catalogue is conveyed by there being no background noise. Groups of ten stars are played simultaneously.
 
[1] One degree is twice the angular size of the full Moon, or the width of one's little finger seen at arm's length.
[2] Minutes, or seconds, of arc are used to describe very small angles. An arcminute is 1/60 of a degree and an arcsecond is 1/60 of an arcminute. One arcminute is roughly the width of the edge of a bank card seen from a distance of 2.5m; one arcsecond is the width of a human hair seen from a distance of 10 m.
 
Read more in the History of Astrometry series: http://sci.esa.int/gaia/history-of-astrometry

FOR FURTHER INFORMATION, PLEASE CONTACT:

Jamie Ferguson
Email: j.ferguson.4@research.gla.ac.uk
Website: http://jfergusoncompsci.co.uk

Last Update: 22 September 2016- EUROPEAN SPACE AGENCY

SOURCE OF THIS DOCUMENT: http://sci.esa.int/gaia/58311-   from-hipparchus-to-hipparcos-a-sonification-of-stellar-catalogues/

martes, 20 de septiembre de 2016


Ciencia

¿Había algo antes del Big-Bang?


Según la teoría de la Cosmología Cíclica Conforme, de Sir Roger Penrose,
el Universo vive un ciclo continuo e infinito de «creaciones»

Para observar correctamente el gráfico expositivo de Penrose hay que desplazarse al video original ,que se encuentra en esta direccion:

http://www.abc.es/ciencia/abci-habia-algo-antes-big-bang-201609170155_noticia.html


La Nebulosa del Cangrejo, formada tras una explosión de supernova. El término «explosión» se queda muy corto para describir lo que ocurrió en el Big Bang - NASA, ESA, J. Hester, A. Loll (ASU)
POR HÉCTOR SOCAS NAVARRO/INVESTIGADOR EN EL INSTITUTO ASTROFÍSICO DE CANARIAS (IAC) @hsocasnavarro Tenerife - Actualizado: 
Sir Roger Penrose es una leyenda viva de la Física. Durante el festival Starmus tuve el placer de escucharle explicando su controvertida teoría cosmológica. Su exposición fue tan elocuente, convincente e incluso divertida, que me causó una profunda impresión. A ver si en este artículo consigo explicarla de forma mínimamente coherente.
Estamos bastante seguros de que el Universo entero comenzó con lo que se llama el Big Bang (la «gran explosión») hace la friolera de 13,700 millones de años. En realidad, lo de la explosión no es una muy buena metáfora. Este nombre lo acuñó despectivamente el astrofísico Fred Hoyle durante la retransmisión de un programa de radio de la BBC en 1949. Hoyle se burlaba con él de la absurda teoría que había propuesto el sacerdote (además de físico y matemático) Georges Lemaître. El propio Einstein al principio tampoco creía en las ideas de Lemaître. El prejuicio de la época era que el Universo debía ser algo estático e inmutable. Pero las matemáticas de Lemaître eran impepinables.
Su solución de las ecuaciones de Einstein implicaba que el Universo debía estar o bienexpandiéndose o bien colapsando, cayendo sobre sí mismo como un edificio en demolición. Visto con perspectiva histórica, debe dar mucha rabia eso de que alguien coja las ecuaciones que son el trabajo de tu vida y las resuelva magistralmente para llegar a una conclusión que aborreces. Las discusiones entre Einstein y Lemaître, que llevaron al primero a proponer la existencia de una «constante cosmológica», merecerían un artículo aparte. Por lo pronto, baste decir que, como buen científico, Einstein acabó aceptando la evidencia, tanto teórica como empírica, que comenzaba a acumularse. Pese a sus prejuicios iniciales, terminó abrazando la idea de que, efectivamente, el Universo se estaba expandiendo.

La singularidad original

La historia sería más o menos así: Al principio de los tiempos, todo el Universo estaba concentrado en una singularidad, un punto de densidad infinita que repentinamente estalló en ese instante inicial, saltando toda la materia, energía y espacio despedidos en todas direcciones. A medida que pasa el tiempo, la Física nos dice que las galaxias van a sentir el tirón gravitatorio unas de otras, y esto debería hacer que poco a poco se vayan frenando. Cuánto se van a frenar dependerá de cuánta masa haya en el Universo. Si hay mucha, la gravedad terminará por dominar, la expansión se detendrá y el Universo volverá a caer sobre sí mismo.


NASA / WMAP Science Team

Si hay poca, la atracción será incapaz de frenar la expansión y el Universo continuará expandiéndose por toda la eternidad, aunque a menor velocidad. La distinción es trascendental, con implicaciones hasta en el plano espiritual. Porque un Universo que vuelve a colapsar se presta a la perspectiva del ciclo infinito de big bang-big crunch, el ciclo continuo y eterno de creación y destrucción. Mientras que la otra posibilidad nos lleva a una insulsa muerte final de toda la existencia, más que nada por aburrimiento.

La sorpresa de la densidad crítica

La cantidad de masa (o, hablando con más precisión, de energía) que se necesita para pasar de un comportamiento a otro se llama «densidad crítica». No hace mucho, cuando yo estudiaba, sin ir más lejos (y créanme que tampoco hace tanto de eso), nos preguntábamos si en el Universo había más o menos densidad que la crítica. Parecía que no, que era muy pequeña, que no sería suficiente toda la masa para volver a cerrar el ciclo. Pero claro, en aquella época no se conocían la materia y la energía oscura. Si tenemos en cuenta estos factores, nos encontramos con uno de los grandes misterios de la cosmología moderna: ¡Resulta que tiene exactamente la densidad crítica!


Radiación de fondo de microondas, una de las mayores evidencias de que ocurrió un Big Bang- WIKIPEDIA
La revelación de que la densidad del Universo es exactamente la crítica (con tanta precisión como somos capaces de medir), sacudió el mundo de la Física. Y es que, aunque sea en el plano subconsciente, se hace difícil no evocar la imagen de un creador para explicar tal coincidencia cósmica. La situación de crisis existencial se resolvió poco después, para alivio de muchos, con la llegada de la teoría de la inflación.
Por ponerlo en términos muy simples, esta teoría nos dice que durante la primera fracción de segundo (técnicamente, desde los 10-36 hasta los 10-32 segundos), el Universo sufrió una expansión tan brutalmente violenta, que el término «explosión» se queda muy corto para describir lo que ocurrió. La expansión en esa época fue acelerada exponencialmente, que es una forma que hay en Física de decir enormemente rápida.
Los cosmólogos suelen decir que todo lo que existe pasó de tener el tamaño de un átomo al de un melón. Por alguna razón se suele usar el melón como medida de referencia. Podrían decir que medía 30 centímetros, que era como un balón de baloncesto o como un florero grande. Pero no, parece que lo del melón lleva camino de convertirse en la unidad estándar de volumen cósmico, algo así como el campo de fútbol lo es hoy en día para medir áreas de monte quemado.
La cuestión es que a este disparatado crecimiento del espacio, infinitamente más rápido que la luz, se le llama inflación. Es un poco contraintuitivo porque, en lenguaje cotidiano, el verbo inflar nos suena mucho más suave y benigno que explotar. Es bien conocido que los físicos no son muy buenos para poner nombres a las cosas. No entendemos bien cómo y por qué ocurrió la inflación salvo que parece estar relacionado con lo que se llama «gran unificación», la época en la que las tres fuerzas fundamentales de la naturaleza eran una, grande y única.

El Universo no se frena

El otro gran descubrimiento que ha tenido lugar desde los tiempos de Einstein es otro hallazgo reciente que también ha causado cierta zozobra existencial. Discutíamos antes las dos posibilidades sobre hasta qué punto sería la gravedad capaz de frenar la expansión del Universo, creando un ciclo continuo de explosión-colapso (Big Bang-Big Crunch) o bien una expansión que se iría ralentizando eternamente pero sin llegar nunca a detenerse del todo. Pues bien, hoy en día sabemos que no va a ser ni lo uno ni lo otro. Resulta que el Universo no se está frenando. No tiene visos de querer volver a colapsar pero tampoco está ralentizando su marcha.
Antes al contrario, las observaciones nos muestran que desde hace 5,000 millones de años (un tercio de su vida), el Universo ha dejado de frenarse y¡ha comenzado a acelerar! Este resultado fue obtenido por dos grupos independientemente y ambos recibieron el Premio Nobel en 2011. Fue tan sorprendente que ninguno de los dos grupos se atrevió a publicarlo hasta que se enteraron de los resultados del otro. Para explicar el fenómeno, los teóricos han tenido que postular la existencia de una «energía oscura», que sería omnipresente en todo el espacio vacío.

El ciclo continuo de Penrose

Hasta aquí hemos explicado la cosmología moderna canónica, la visión aceptada mayoritariamente por los expertos en el tema. ¿Qué es, entonces, lo que añade Penrose? Pues, según su teoría, estas dos revelaciones, la inflación y la expansión acelerada del Universo, están íntimamente relacionadas. De hecho, serían la misma cosa. Para Penrose, el Universo vive un ciclo continuo e infinito de «creaciones», pero no en el modelo tradicional de explosión-colapso.


Una fotografía de Roger Penrose, tomada en 2005

En su lugar, Penrose postula que cada uno de los ciclos (que él llama eones) acaba con una fase de expansión acelerada que se convierte en la inflación del eón siguiente. Lo de Penrose no es una ocurrencia, es una teoría. Esto significa que ha resuelto las ecuaciones de la relatividad general y los números cuadran salvo por un factor de escala. Quiere decirse que las escalas del nuevo universo son mucho mayores, tanto en el espacio como en el tiempo.

De Universo a melón

Así, todo nuestro Universo en expansión acelerada, está camino de convertirse en lo que sería un melón del Universo siguiente. Y los miles de millones de años que dura esta expansión serían la breve fracción de segundo en aquel nuevo Universo. Quizás en un futuro increíblemente distante, habrá criaturas inconcebiblemente grandes y lentas en el siguiente eón, investigando esta época en la que vivimos hoy en día, a la que quizás den el absurdo nombre de inflación y quizás la consideren el origen de su universo. Una implicación particularmente profunda de todo esto es que, de ser cierto, estaríamos ahora mismo viviendo un nuevo big bang que comenzó hace 5,000 millones de años y lo estaríamos viendo transcurrir a cámara superlenta.
Quiero resaltar que esta teoría, llamada Cosmología Cíclica Conforme, no es la aceptada por la mayoría de los cosmólogos. Sin embargo, no hay nada incorrecto o erróneo en ella, que sepamos. Penrose es uno de los mayores expertos mundiales en la física de la relatividad general y la cosmología. Su teoría cumple con la física conocida y esto sí que es un mérito que le concede la comunidad. Al igual que hizo Lemaître hace un siglo, ha encontrado una solución matemática correcta a las ecuaciones de la Física que conocemos, pero es una solución que aborrecen sus colegas por razones más filosóficas que científicas.
Un aspecto particularmente fascinante es que, como toda buena teoría, la naturaleza cuantitativa de la cosmología de Penrose le permite hacer predicciones. Las ecuaciones indican que los eones no son completamente independientes y algo de información se puede transmitir de uno a otro. En particular, las ondas gravitacionales (ésas que recientemente detectó el experimento LIGO) creadas por catástrofes cósmicas en el eón anterior podrían atravesar la época de la inflación y llegar hasta nuestros días. Estas ondas producirían patrones de anillos concéntricos en el fondo cósmico de microondas. Ni que decir tiene que muchos investigadores están ya manos a la obra buscando esos anillos. Si se encontraran, sería la primera observación de algo que ocurrió antes del Big Bang.
Autor :
Héctor Socas Navarro , investigador del Instituto de Astrofísica de Canarias (IAC) y divulgador en «Coffe Break». El autor agradece al Dr Jose Alberto Rubiño por su lectura crítica y comentarios para mejorar este artículo.

FUENTE: 
 Ciencia 

Para una correcta lectura del gráfico expuesto por Penrose debe ir a esta direccion:  
http://www.abc.es/ciencia/abci-habia-algo-antes-big-bang-201609170155_noticia.html


miércoles, 14 de septiembre de 2016

NEWS IN SCIENCE...SCIENCE NEWS...

Announcements from the Simons Foundation
September 2016
Simons Foundation logo
Physics of Feather Color
Hidden in the color of birds and their mating choices, says Junior Fellow Rafael Maia, is information that can help elucidate the evolution of complex behaviors.
Prime Numbers
Prime Numbers Reveal the Practicality of Impracticality

Understanding primes can lead to many applications, but overemphasizing the practicalities of primes has its perils.
Special Holonomy
Announcing the Simons Collaboration on Special Holonomy in Geometry, Analysis and Physics

The collaboration will advance the theory and applications of spaces with special holonomy and the geometric structures, calibrated submanifolds and instantons associated with them.
Bootstrap
Announcing the Simons Collaboration on the Non-Perturbative Bootstrap

The critical challenge for this new collaboration is to map and understand the whole space of quantum field theories, including strongly coupled models.
Events
Dr. Steven Salzberg
Metagenomic DNA Sequencing to Detect and Diagnose Infections

In this lecture, Dr. Steven Salzberg will describe how scientists are using the latest sequencing technology in combination with new, very fast algorithms to sequence a complex mixture of DNA from a sick patient and, in some cases, identify the causative agent of an infection.


Wednesday, September 21, 2016           
5:00pm - 6:15pm
Gerald D. Fischbach Auditorium       

Dr. Andrea Ghez
The Monster at the Heart of our Galaxy

Dr. Andrea Ghez will discuss the latest developments in the study of black holes, specifically how the environment around the black hole at the center of the Milky Way is quite different than astronomers expected. She will also describe how studying the orbits of stars at the galactic center could improve our understanding of gravity.


Wednesday, September 28, 2016           
5:00pm - 6:15pm
Gerald D. Fischbach Auditorium       

Dr. Ruth O'Hara
Tuberous Sclerosis: Shedding Light on the Neural Circuitry of Autism

Dr. Mustafa Sahin, who studies the basis of Tuberous Sclerosis Complex (TSC) in cell culture, animal models and the clinic, will present an update on translational research in TSC.


Wednesday, October 5, 2016           
5:00pm - 6:15pm
Gerald D. Fischbach Auditorium       

Funding Opportunities

Simons Fellows Program in Mathematics and Physical Sciences

The Fellows Programs provide funds to faculty for up to a semester-long research leave from classroom teaching and administrative obligations.

DEADLINE: September 29, 2016.                 


Simons Collaboration on the Global Brain Postdoctoral Fellowships

The Simons Collaboration on the Global Brain (SCGB) seeks applicants for postdoctoral fellowships. Intended work is at the interface of theory and experiment on the nature, role and mechanisms of the neural activity that produces cognition.

DEADLINE: October 3, 2016.                 


Simons Collaborations in Mathematics and the Physical Sciences

The aim of the Simons Collaborations in MPS program is to stimulate progress on fundamental scientific questions of major importance in the broad area of mathematics, theoretical physics and theoretical computer science.

DEADLINE: October 3, 2016.                 


Targeted Grants to Institutes in Mathematics and Physical Sciences

The Targeted Grants to Institutes program is intended to support institutions in the mathematics and physical sciences through funding to centers of excellence, to help establish scientific culture and strengthen contacts within the international scientific community.

DEADLINE: October 13, 2016                 


Simons Early Career Investigator in Marine Microbial Ecology and Evolution Awards

The purpose of these awards is to help launch the careers of outstanding investigators who use quantitative approaches to advance understanding of marine microbial ecology and evolution. 

DEADLINE: November 7, 2016                 


Simons Symposia Program

The program brings mathematicians, theoretical physicists and theoretical computer scientists together to interact and collaborate on one topic, or tightly connected groups of topics, over a series of meetings.

DEADLINE: November 9, 2016                 

 
LEARN MORE AT SIMONSFOUNDATION.ORG

Sign Up for Grants Information
Foundation News
Mathematical Impressions
Simons Science Series
Connect with the
Simons Foundation
Twitter
Facebook
Email
Copyright © 2016 Simons Foundation. All rights reserved.
You previously expressed interest in receiving updates from the Simons Foundation.

Our mailing address is:
Simons Foundation
160 Fifth Ave
Floor 7
New York, NY 10010

Add us to your address book


unsubscribe from this list    update subscription preferences